EdPotential Head of Department Guide (NZ)
This article gives an overview of EdPotential's useful features for Heads of Department.
Course Report
Access
How to Access Your Course Reports on EdPotential 📊 - Watch Video
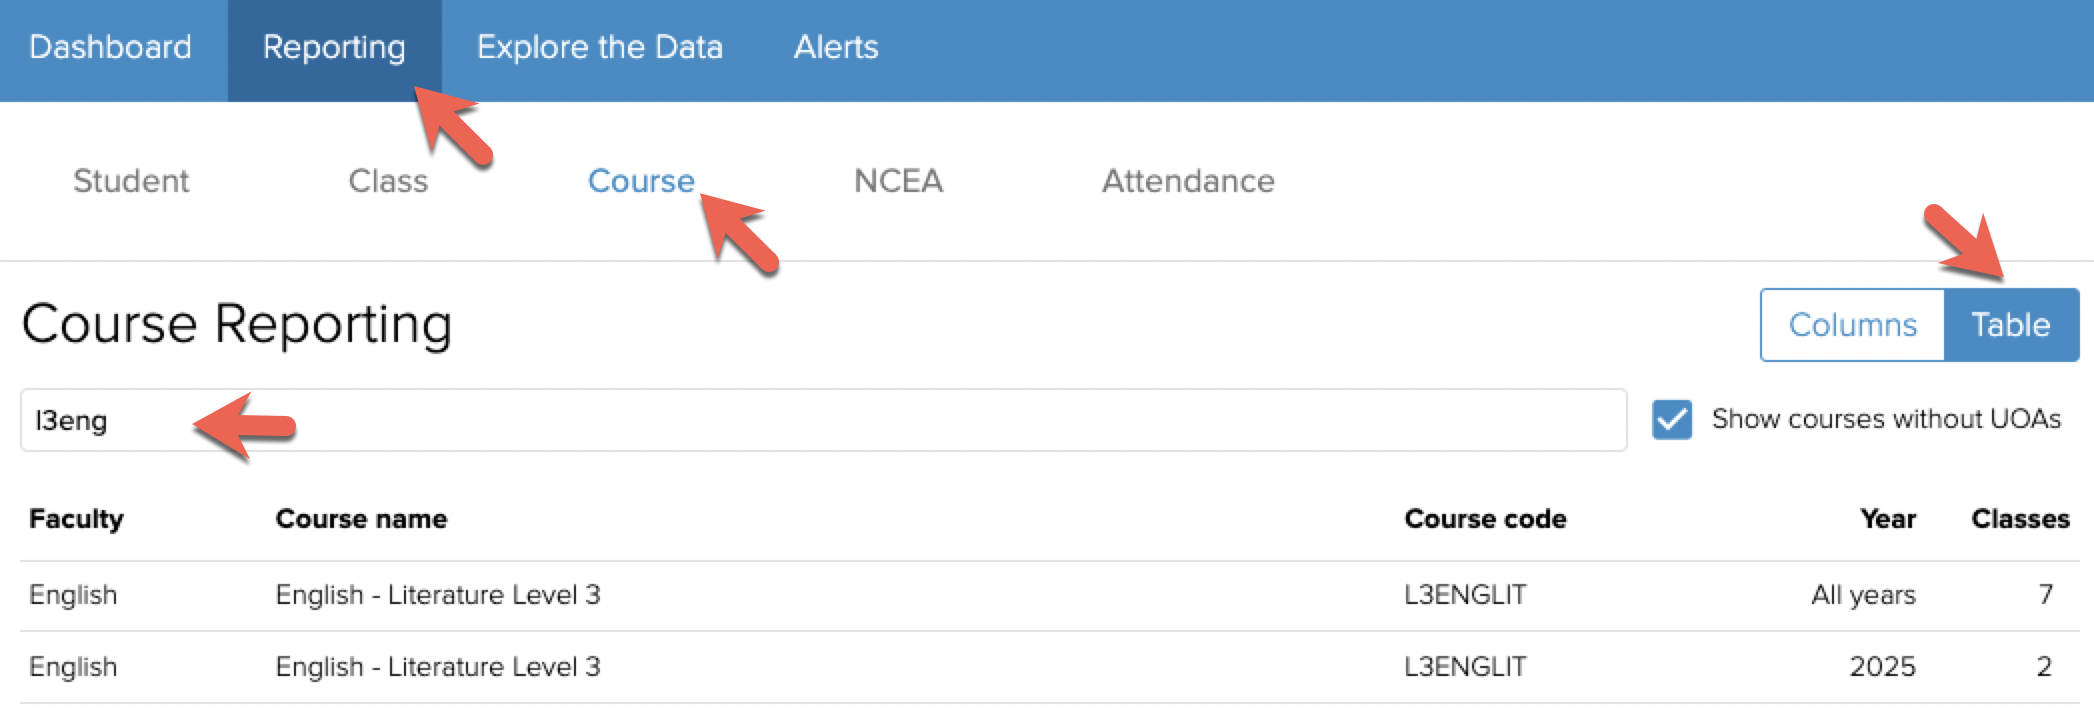
To access a course report
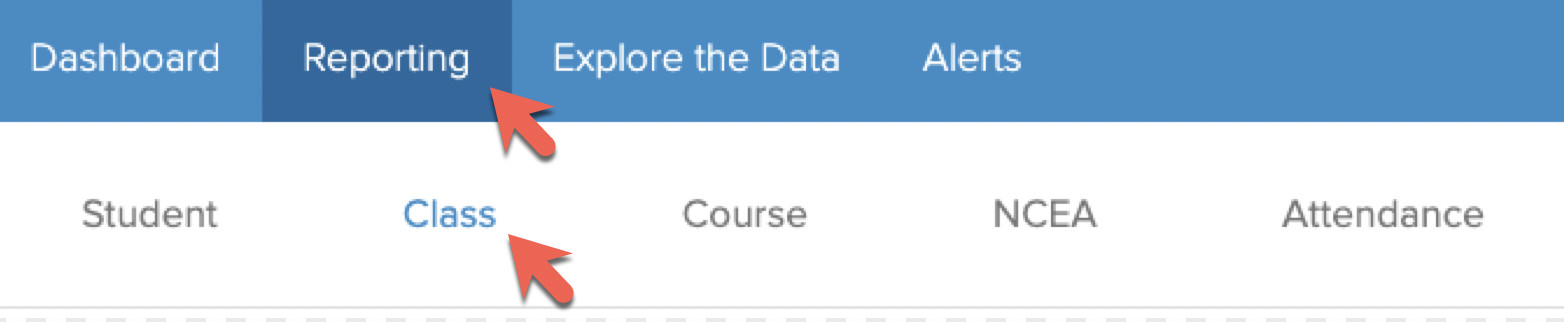
- Select the second tab Reporting
- Select the third sub-tab Course
- Select Table to show all courses
- Enter your course name or code in the search bar
- Select the row containing your course
- If you are wanting to view just one year's results, select that year's report
- If you are wanting to compare results over time, select the All years report
Overview
The course report provides an overview of student progress in the course in
- NCEA assessments
- Internal assessments
- Junior external assessments
NCEA results are given in terms of grade. The number of grades will differ from the number of students as students are likely to have received multiple grades. You can choose to show results by credits by selecting Credits at the top right of a course report.
Interactive Chart Features
- Hover
- Hover your mouse over the chart sections to see the details
- Legend
- Left click on a legend item to remove it from the chart
- Right click on a legend item to show only that item
- Menu
- Select the 3 dots at the top right of the chart to view the menu options
- Change the chart view with Plot Vertical/Unstack
- Change to Plot absolute to view results by the number of grades
- Select Show table to add a table of the values displayed in the chart
2026 Updates
The 2026 updates in the course report are demonstrated in this video.
EdPotential | Course Reporting - Watch Video

Available Summaries
The course report for a single year includes the following NCEA summaries
- All results
- A comparison to national results
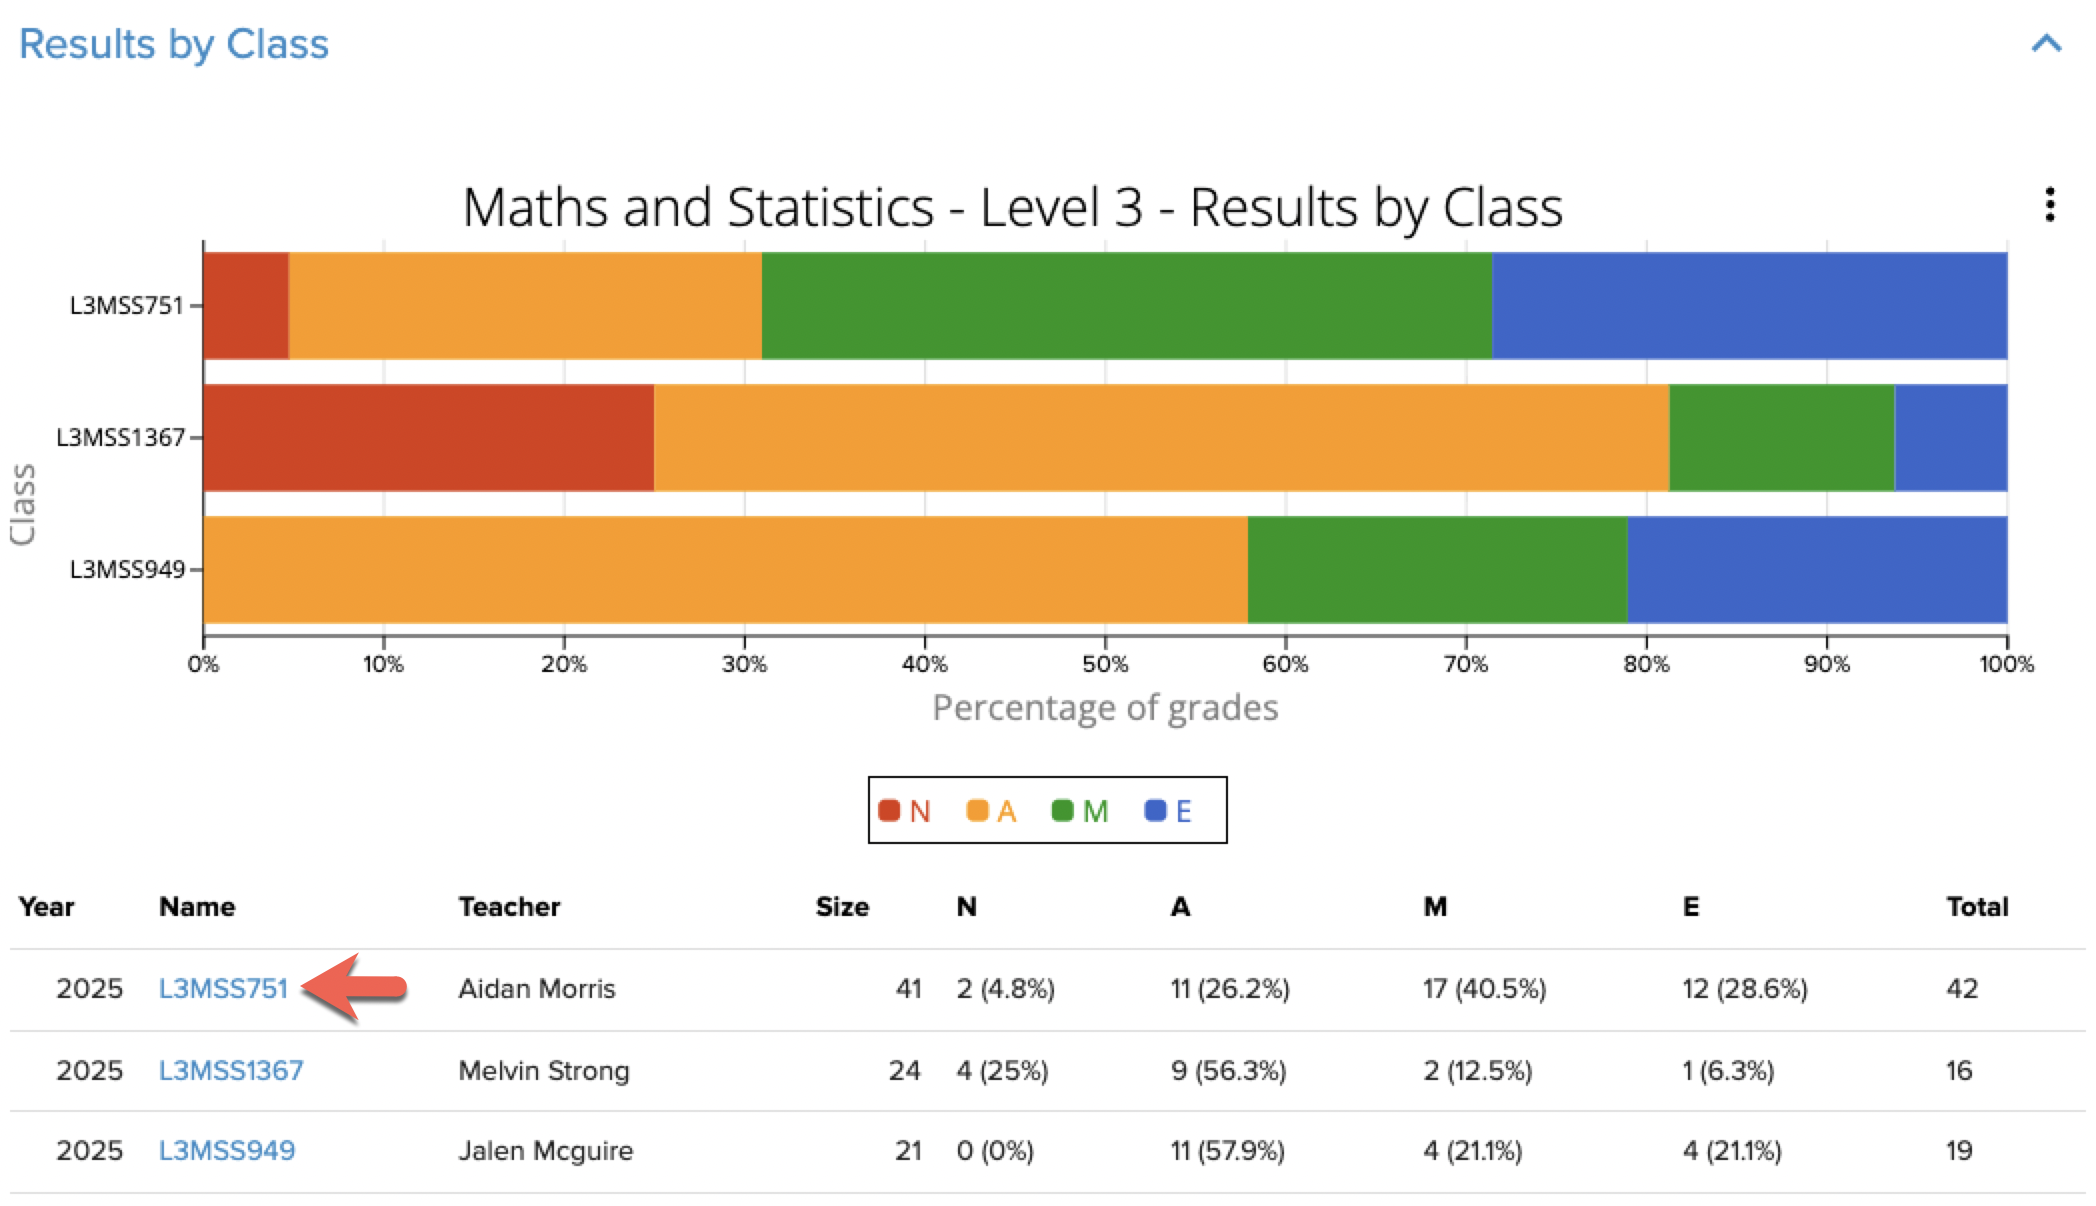
- Results by class
- Results by standard
- Results by gender
- Results by ethnicity
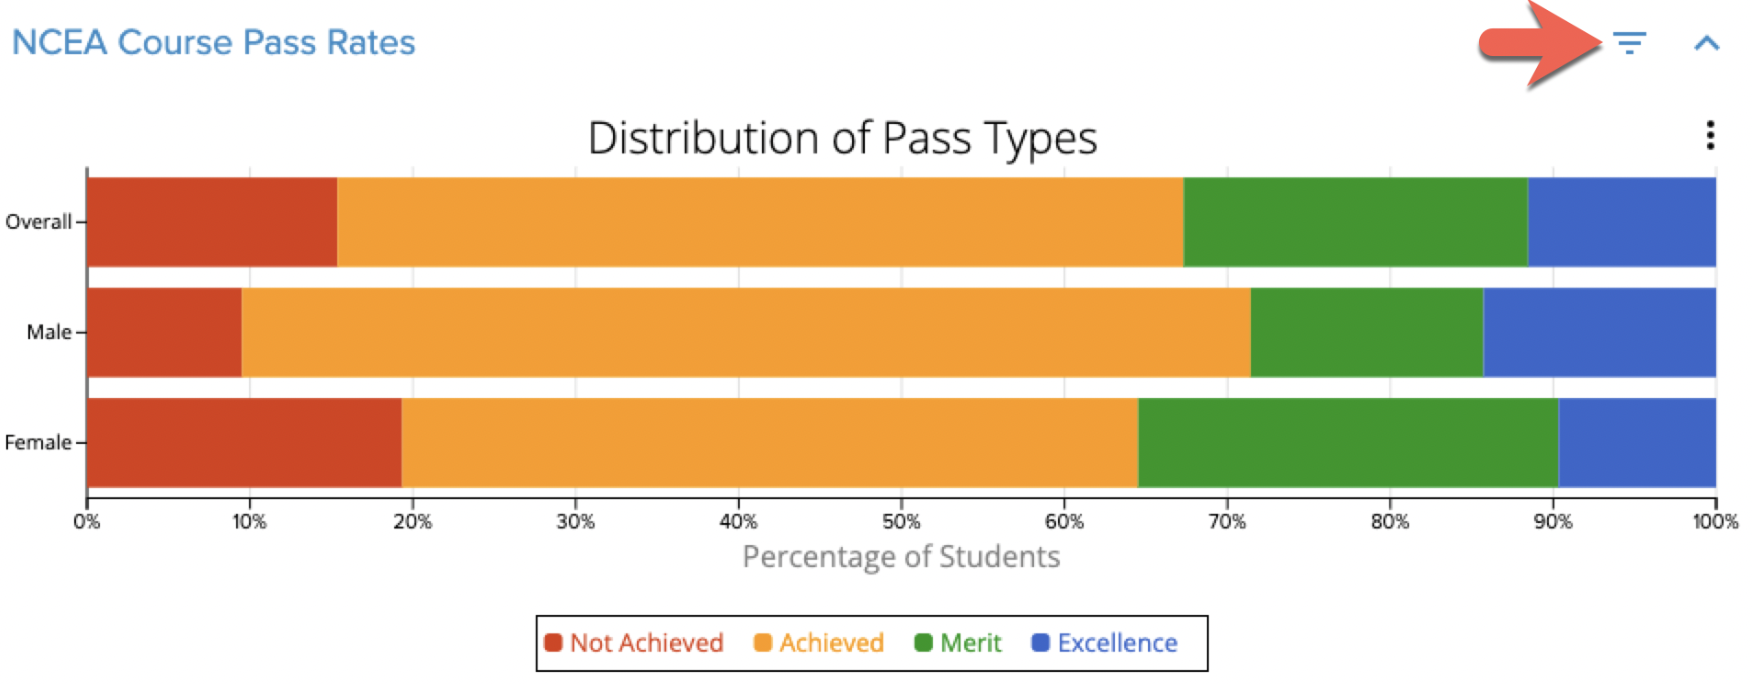
- Course pass rates: The percentage of students who have gained 14 or more credits at the given grade level. Use the filters to change the split type, the credit threshold and the grade levels included.
- A table of students and their results is included. Order by any column by clicking on the heading; once for smallest to largest values and twice to reverse the order.
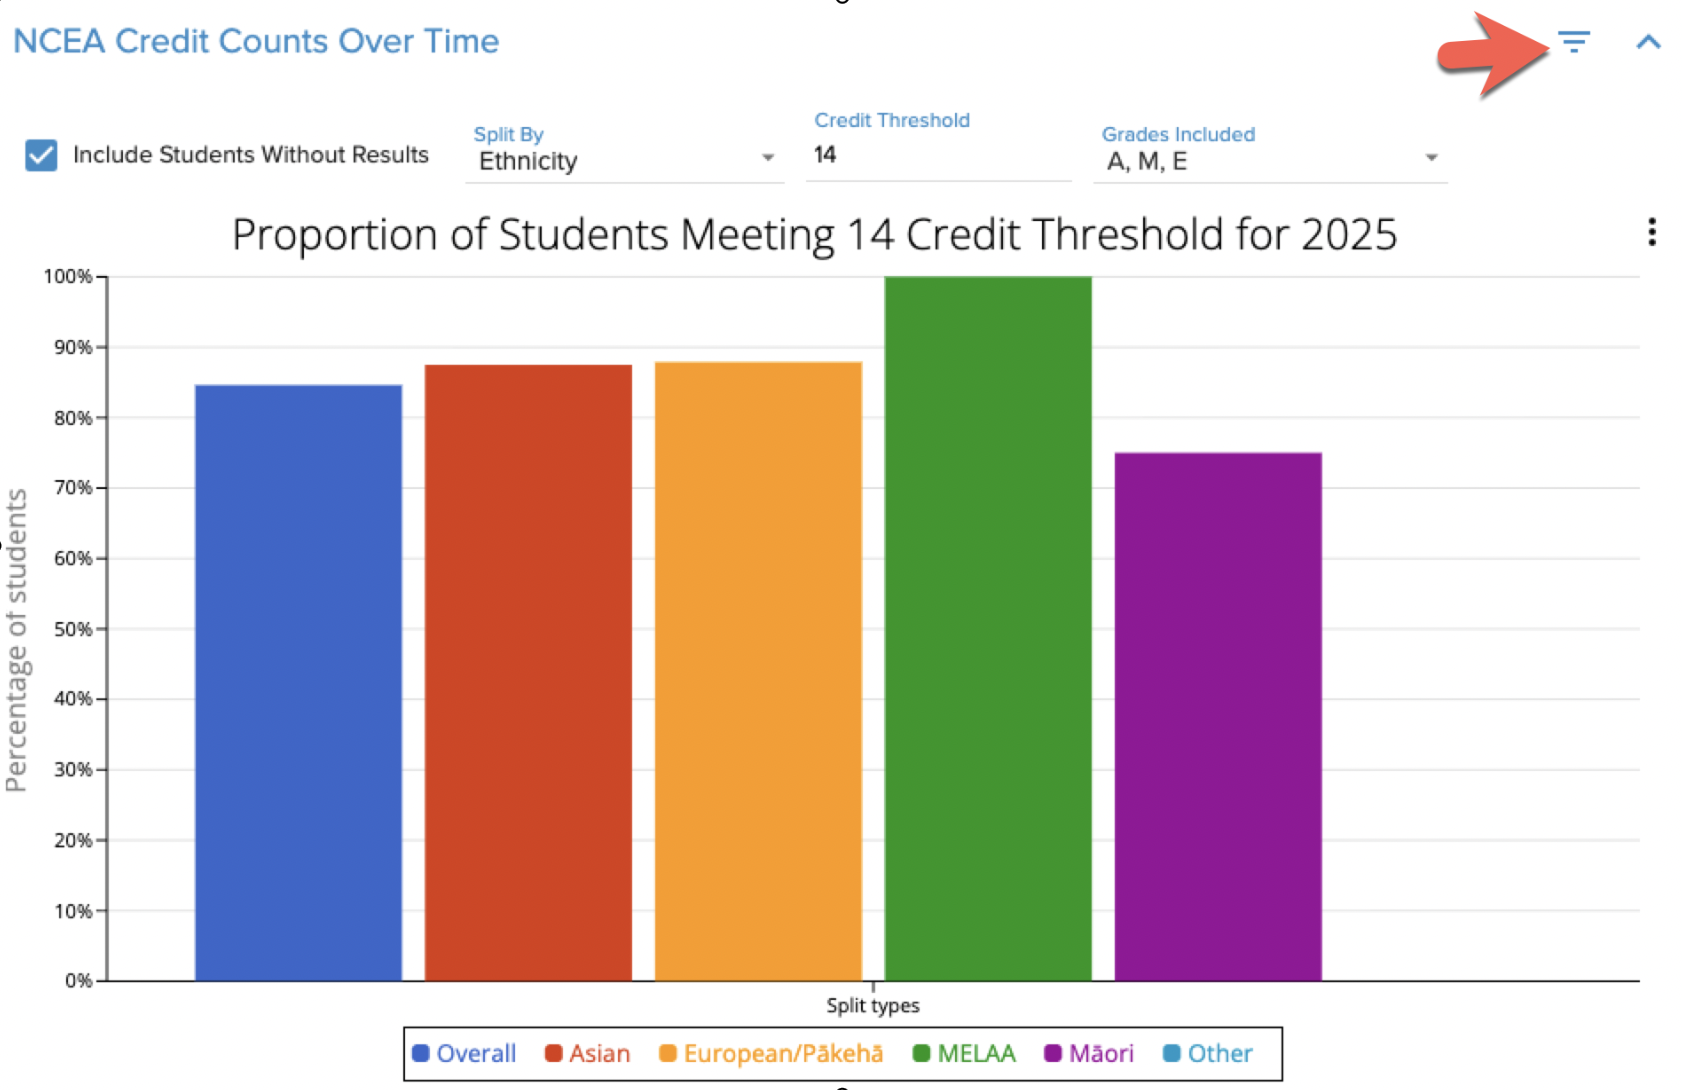
- Credit counts: The proportion of students meeting a selected credit threshold. The default is 14 credits. Use the filters to change the split type, the credit threshold and the grades included.
The course report for a single year includes the following summaries when available
- Internal course results: Grouped by class and by assessment
- PAT results: The most recent results are shown by default. Use the filter to view previous years' results
- e-asTTle results: The most recent results are shown by default. Use the filter to view previous years' results
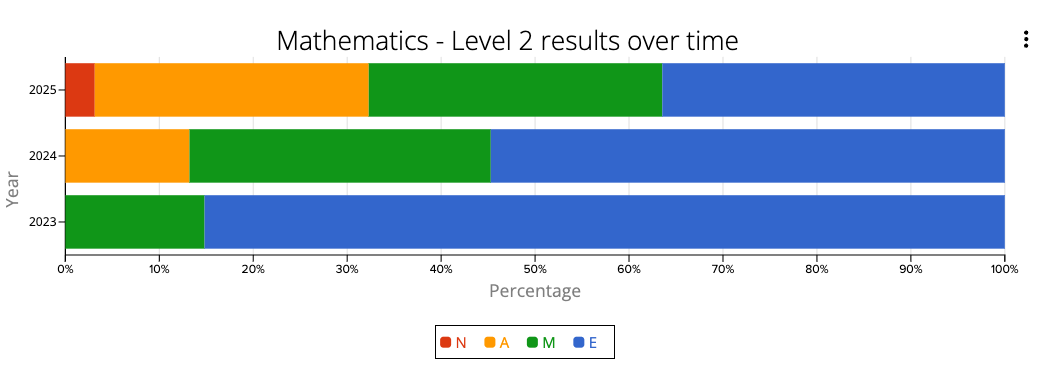
The All years course report contains the following NCEA summaries
- A summary of results by year: The proportion of N, A, M, E grades each year
- A comparison to national results each year
- Grade counts over time: The proportion of N, A, M, E grades each year as a line graph
- GPA results over time: The average GPA for the course and for each assessed standard
- Credit counts over time: The proportion of students meeting a selected credit threshold (the default is 14 credits. Use the filters to change the split type, the credit threshold and the grades included)
- A table of students and their results is included
- Course pass rates: The percentage of students who have gained 14 or more credits at the given grade. (Use the filters to change the split type, the credit threshold and the grade levels included)
- Results in each standard over time
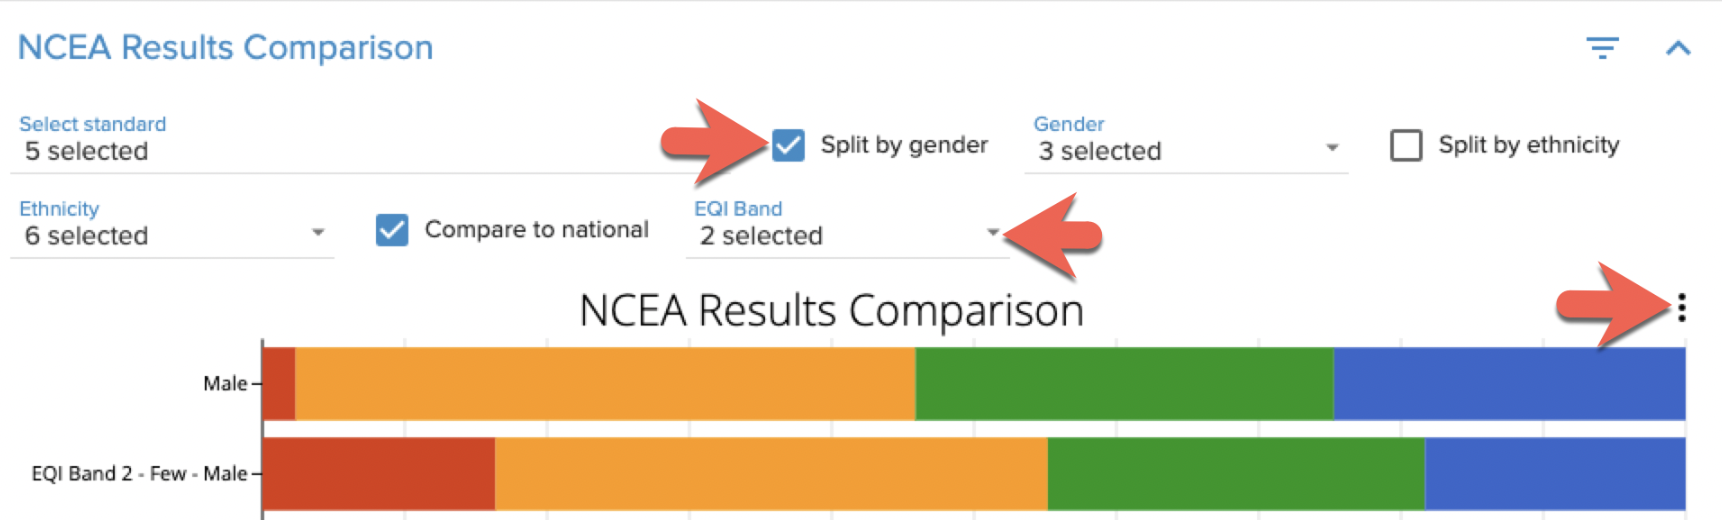
- Results in one standard can also be compared to national results over time in the NCEA Results Comparison. You can do so by opening the filters and selecting only one standard.
Class Report
Access
To access a class report, click on the linked class name in a course report
Alternatively, you can access any class report by
- Selecting the second tab Reporting
- Selecting the second sub-tab Class
Overview
The class report enables your teachers to compare results by standard, gender, ethnicity or a custom field. The fields available for selection are those which are entered in KAMAR and shared with EdPotential.
Features
A number of icons at the top right of the report are available.
- Use the pencil icon to add comments to the report. Once comments are added you can print the report with the comments included. These comments will not be saved.
- Use the print icon to save the report as a .pdf file
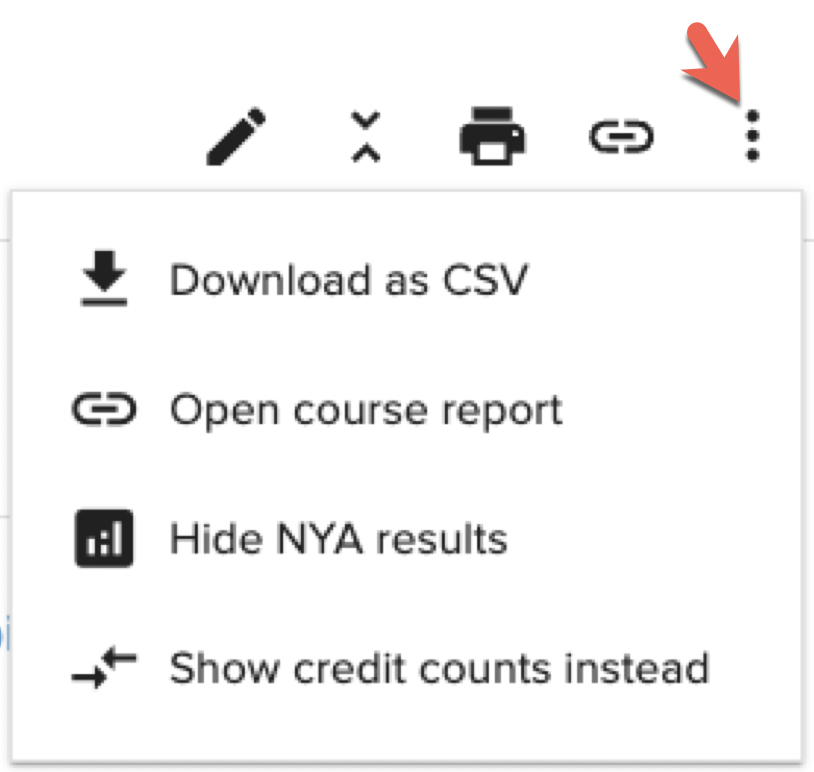
- Use the menu (the 3 dots) to
- Download the data within the class report to a .csv file
- Open the related course report
- Hide NYA (not yet assessed) results
- Change the report summaries to be by credit count rather than by grade
Available Summaries
The class report includes NCEA summaries similar to those in the course report
- All results
- A comparison to national results
- Results by class
- Results by standard
- Results by gender
- Results by ethnicity
- Class pass rates: The percentage of students who have gained 14 or more credits at the given grade level. Use the filters to change the split type, the credit threshold and the grade levels included.
- Credit counts: The proportion of students meeting a selected credit threshold. The default is 14 credits. Use the filters to change the split type, the credit threshold and the grades included.
You'll also find a student list complete with NCEA grades and GPAs. The Class GPA % is based on the results in this class and can be compared to the NCEA GPA %, which is based on all results for the given student.
The class report includes the following summaries when available
- Internal course results: Grouped by assessment
- PAT results: The most recent results are shown by default. Use the filter to view previous years' results
- e-asTTle results: The most recent results are shown by default. Use the filter to view previous years' results
Explore the Data
Access
To access Explore the Data go to the third tab and select Browse
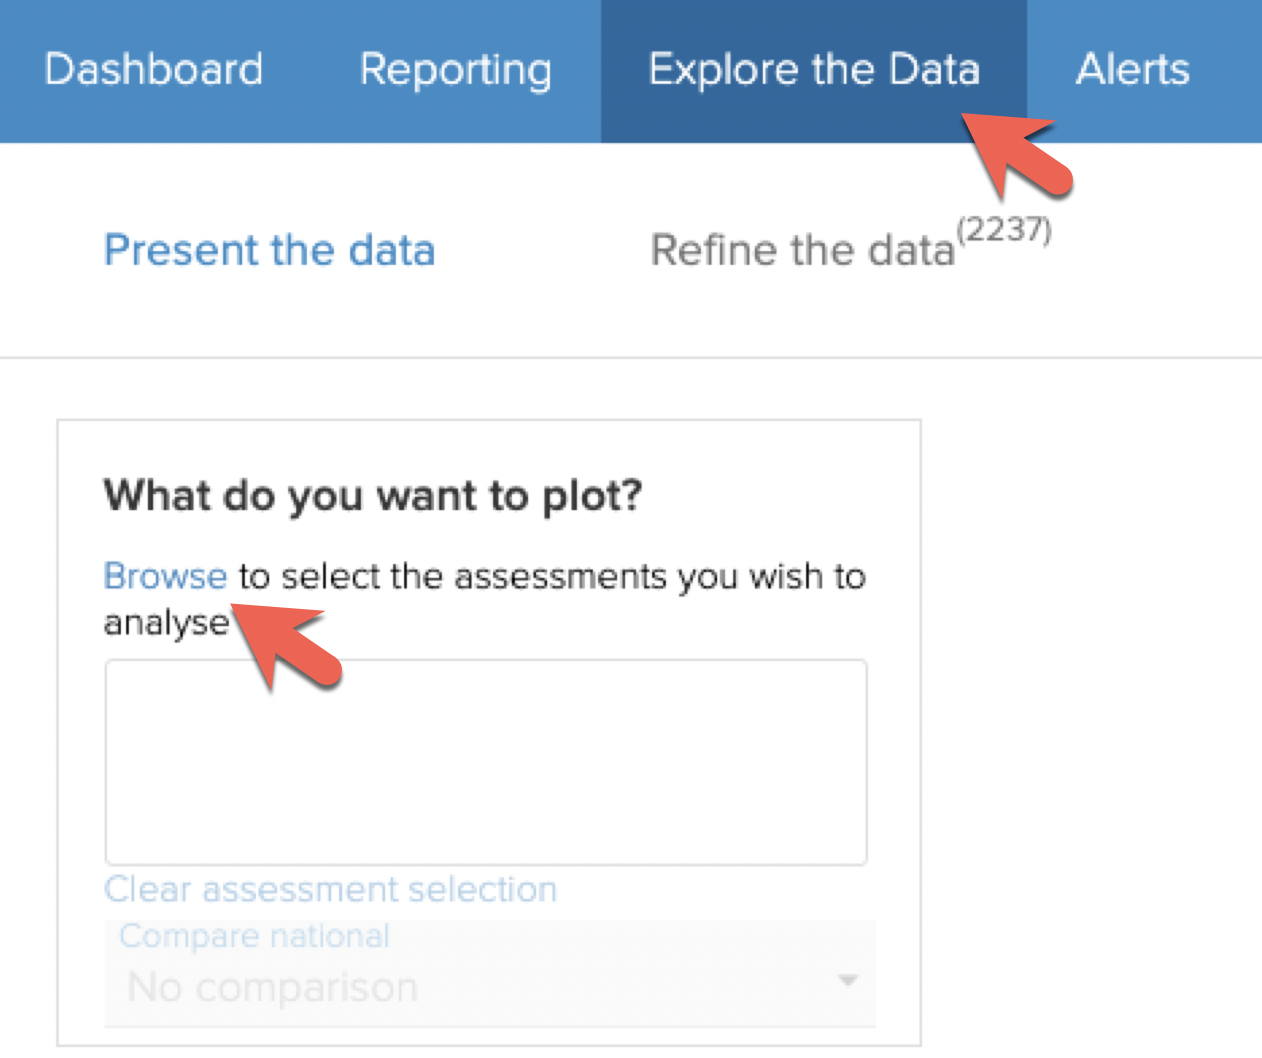
Overview
Explore the Data is the place to go for a deeper dive into your data.
Available Analyses
Once you have selected Browse, as shown above, you will be able to view the types of data available.
For example, to view course endorsements in your subject area, follow the NCEA pathway shown below.
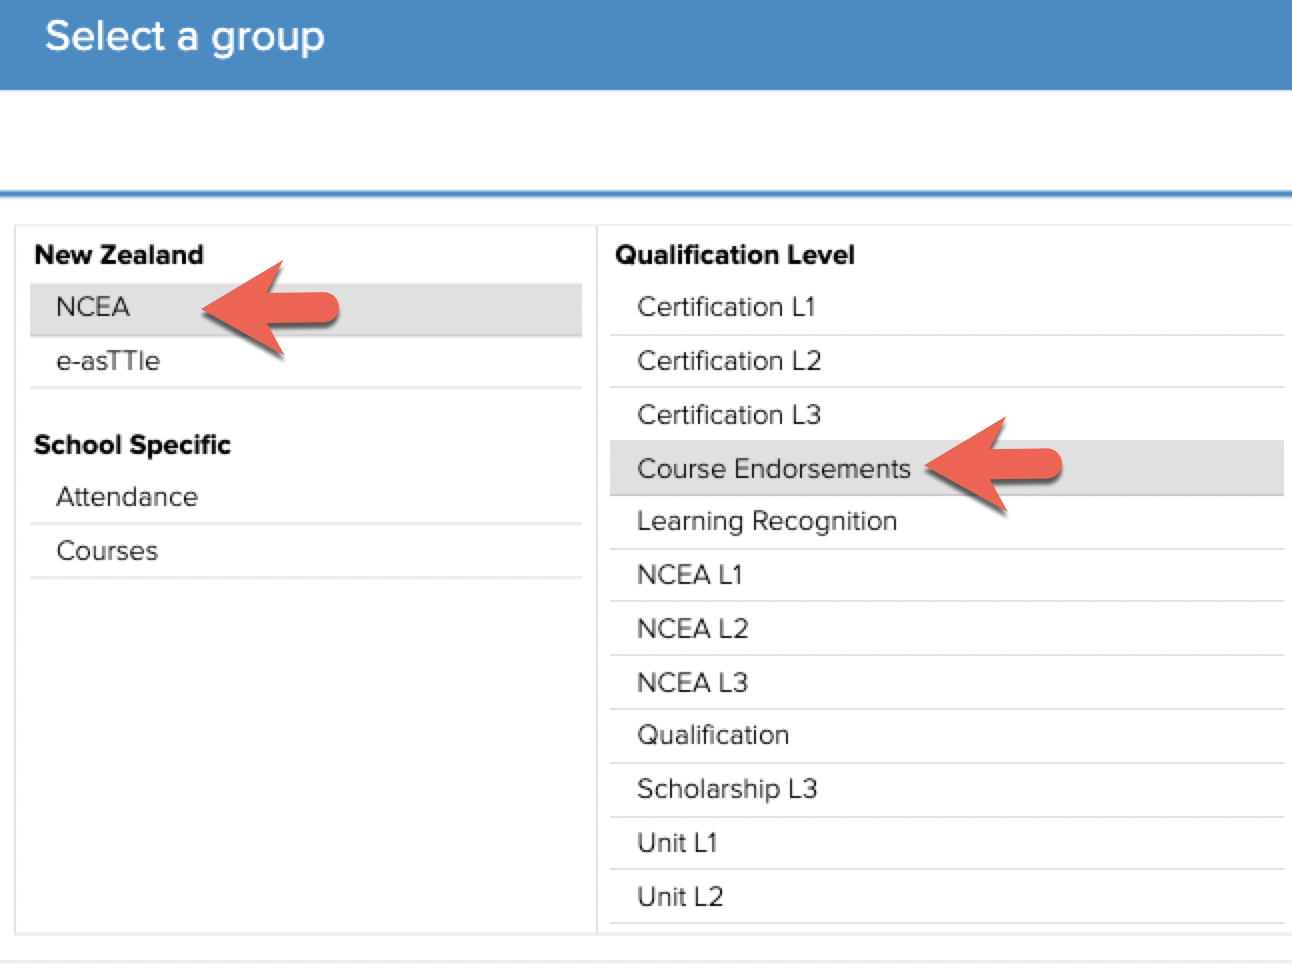
Scholarship and standard results can be found in a similar way.
To view results in the Common Assessment Activities, follow the pathway shown below.
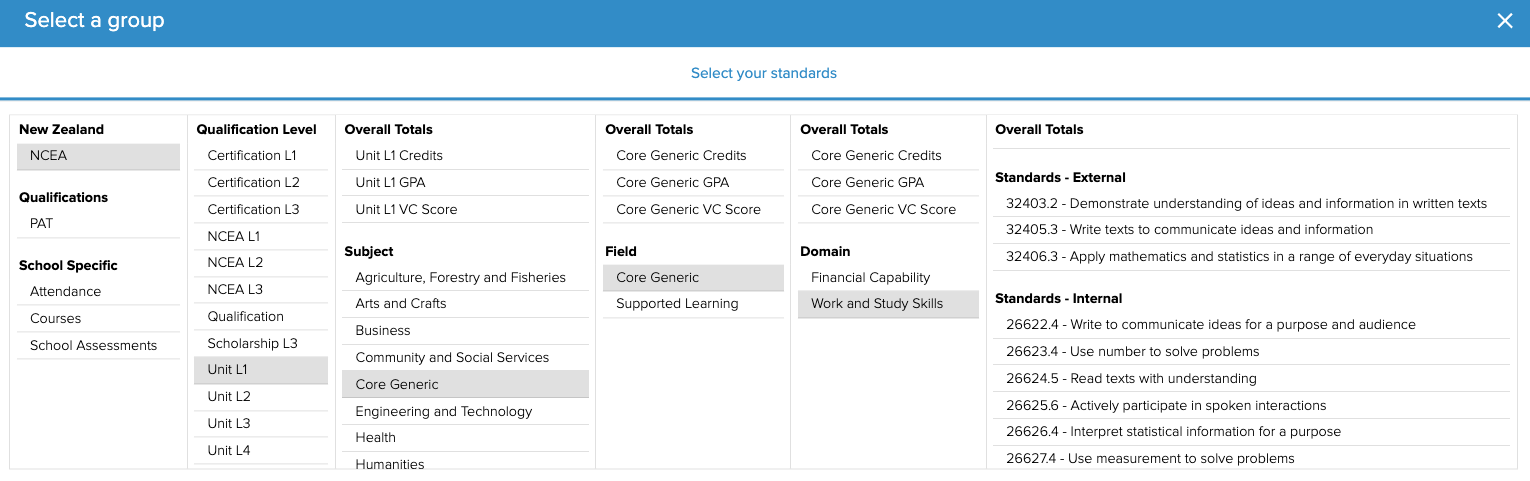
You may select one or more standards. Once they are selected, click OK.
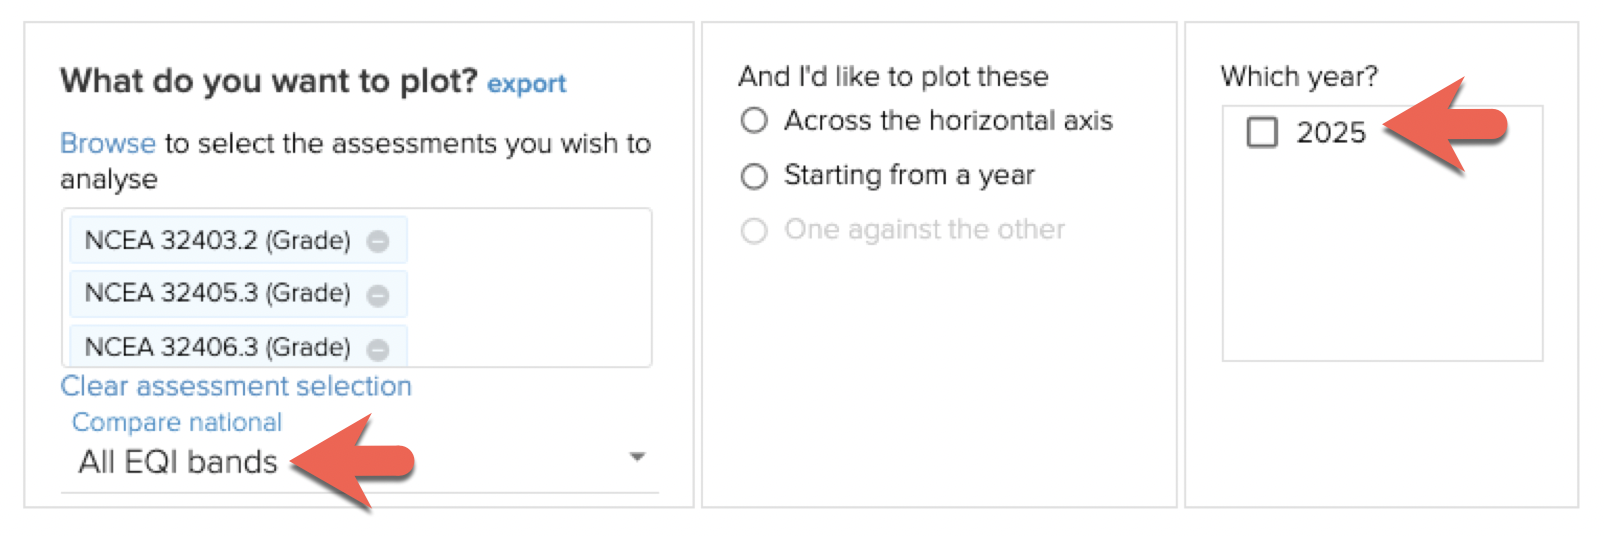
Select the year.
You may choose to compare results to national results.
NCEA Reporting
Access
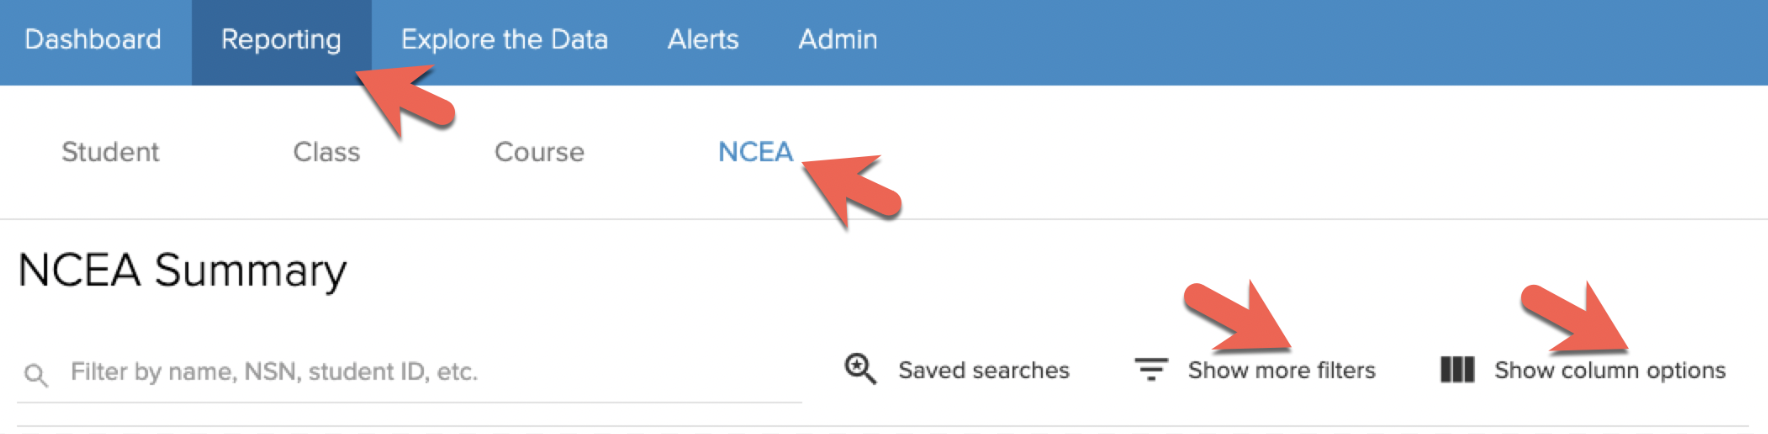
To access NCEA Reporting
- Select the second tab Reporting
- Select the fourth sub-tab NCEA
Select Show more filters and Show column options.
Overview
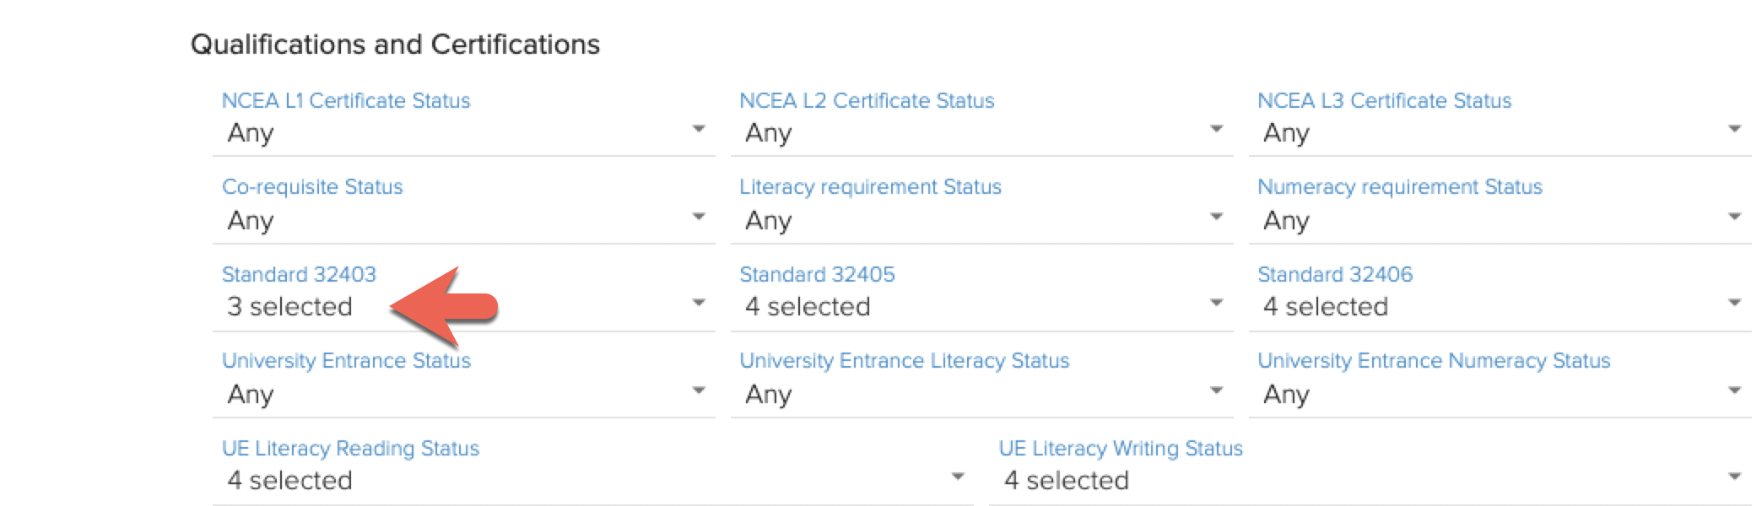
NCEA Reporting enables you to view and download a list of students who meet an NCEA-related criteria. You can choose which data fields are included in the list.
Use the filters to select WHO is in your list
Use the column options to choose WHAT is in your list
For example, to view a list of Year 11 students who have yet to pass the reading corequisite standard, 32403, select Year level 11 and untick Passed in the Standard 32403 filter.
Alerts
Read about how to bookmark a group of students and to set up an alert in this guide.
For any questions or feedback regarding this feature, please contact our team.